Scroll down to download this data.
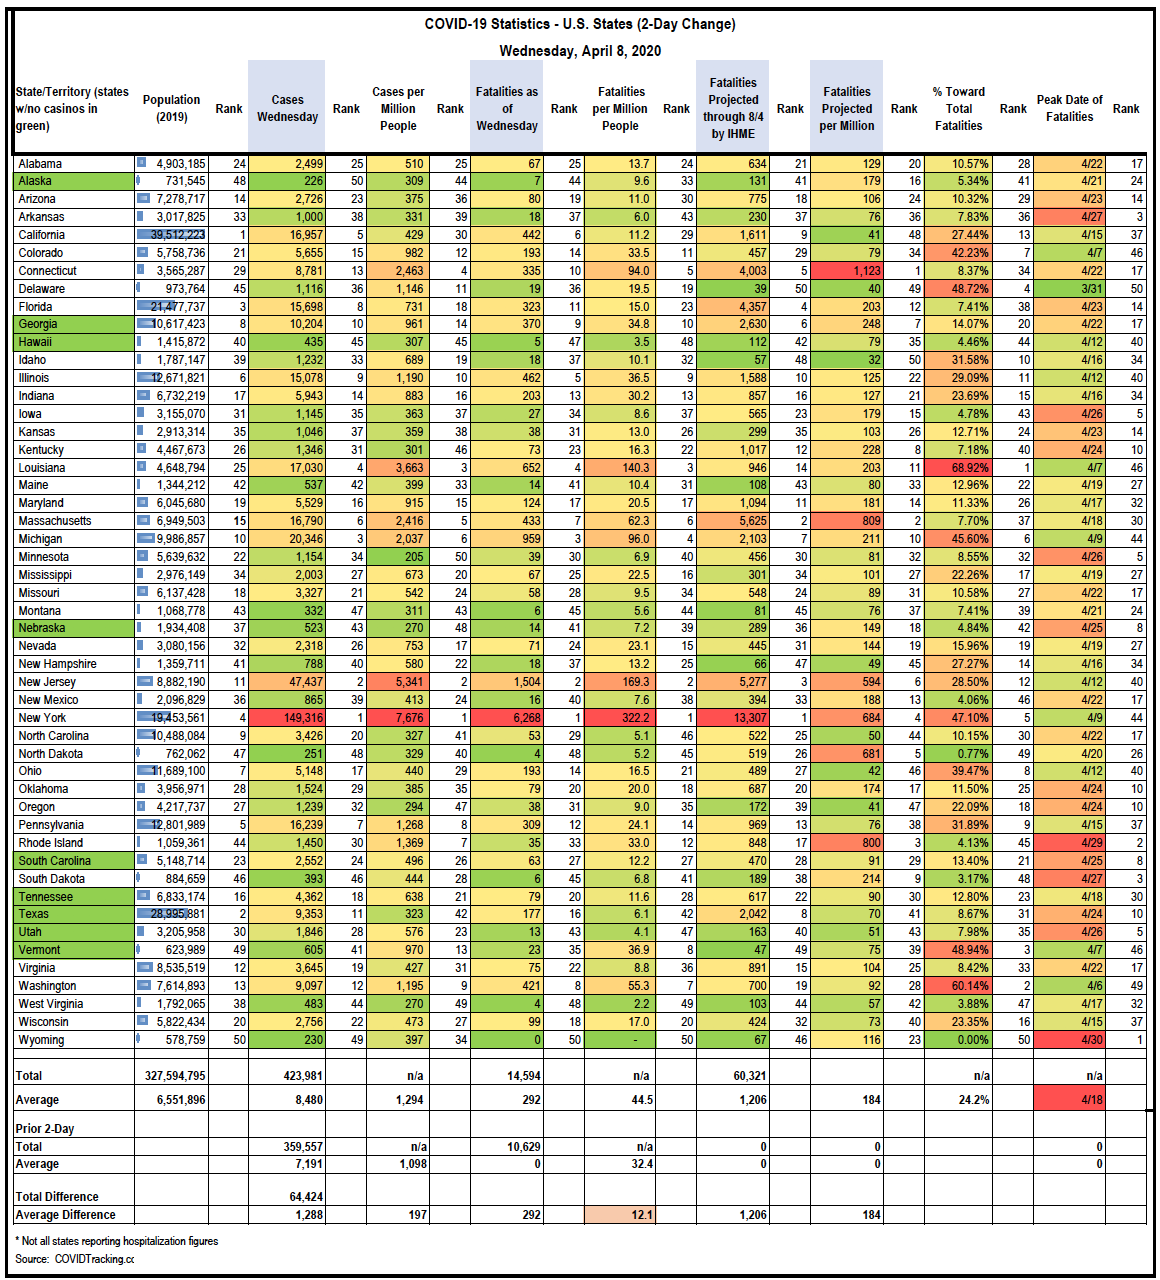
Peak Dates and Total Fatality Estimates from IHME. I decided to add what many consider to be the “official” estimates of peak date of pain and total fatalities (through Aug 4).
I do not necessarily agree with all of their projections (can’t wait to assess…), but most appear to be reasonable. For example, North Dakota has 4 deaths currently, but their model projects 591 by August. I know ND is behind the curve, but that total seems really high (800 per million). Others may not be pessimistic enough (those that are really behind on testing and have high infection rates per test, like Michigan).
In general, I believe if we stay behind masks and mostly cooped up for the next month or two (we can discuss the economy later), these figures will be closer to 40k, not 60k.
The states are sorted alphabetically and you can see that some of them have hit or passed their ‘peak’ dates already. But it also suggested we are only 24% through the worst of it. Average peak day is currently April 18th, so the weekend after Easter. I believe I’ve been saying for sometime that the weekend after Easter would be the peak and it appears the IHME is now in agreement.
I’m anxious to talk about the economy b/c no business can stay afloat if all of their customers are out of work or out of money. We have got to find a way to “mask up” and get back to a safe way of working. I’m encouraged by the plasma testing going on at Mayo Clinic and the 254 other testing regimens going on around the world. There is so much research happening so fast, that while this pandemic may not get a clear answer as soon as desired, my bet is we will solve 100 other problems along the way. How’s that for optimistic? I’m quite convinced of it. All of this research and testing will help us fight many other issues. Have a great day all!


