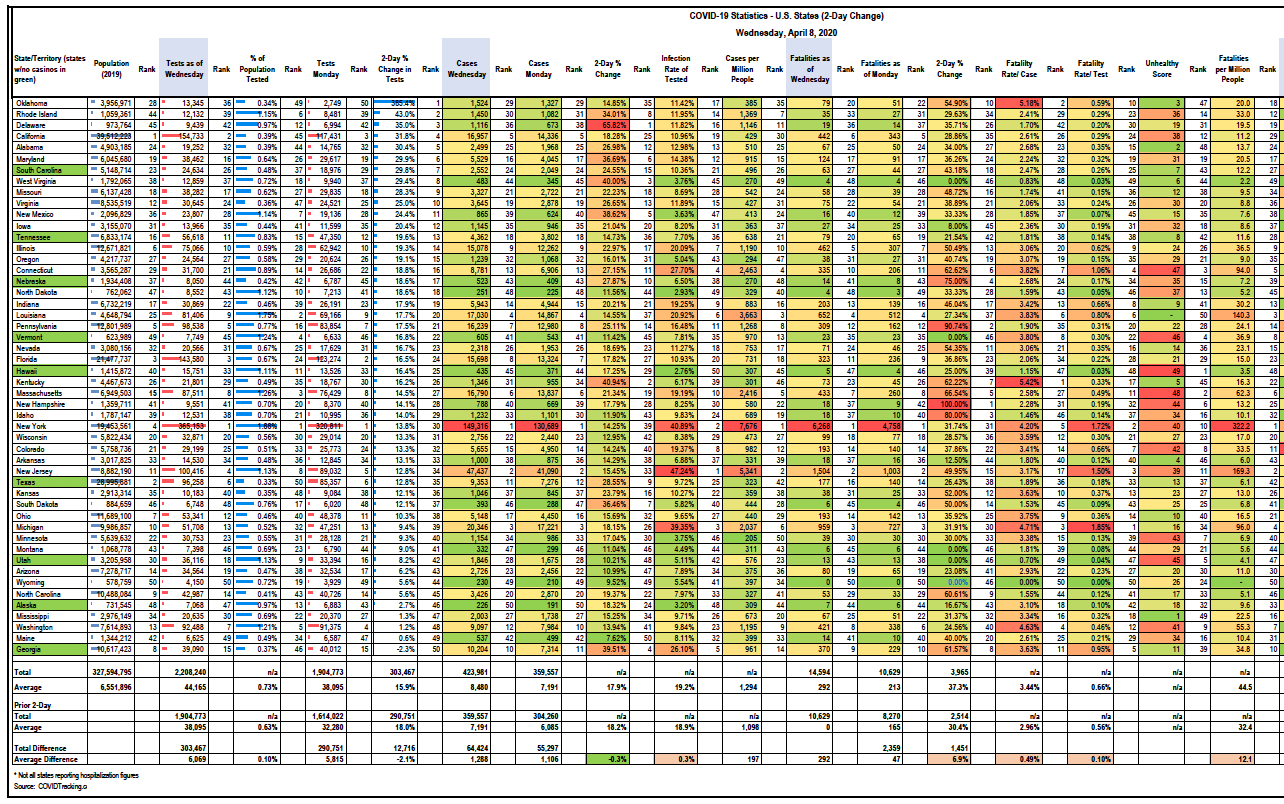
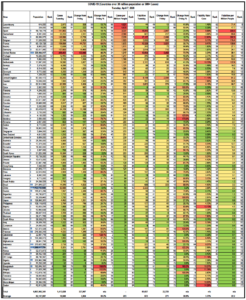
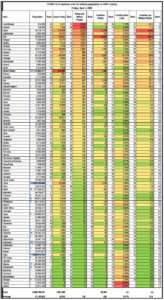
HSP compiled the following COVID-19 Statistics for U.S. States and Territories (sorted by cases per million people). This data stands as of Wednesday, April 8, 2020.
Scroll down to download this excerpt from HSP’s database.
State by State Report for 4/8/20. The number of tests continues to increase, although the rate of increase (about 150k per day) has been about the same for a few days now. Still, at 2.2 million tests, the U.S. has tested more people than any country that is reporting testing data. The tests per capita are still lower than Italy or S. Korea, but we are gaining…
Oklahoma took a needed leap up (nearly 400%) in tests and their positive tests did not increase at a similar level, luckily. This suggests some lag in the testing data.
States with the highest portion of their population tested are: NY (1.88%), LA (1.75%), MA (1.26%), VT (1.24%) and WA (1.21%). States on the low end: Texas (0.33%), OK (0.34%), KS (0.35%), VA (0.36%) and GA (0.37). This metric concerns me for these states in particular, especially when tied with other metrics we track, including increases in new cases.
More about infections in the next post.


