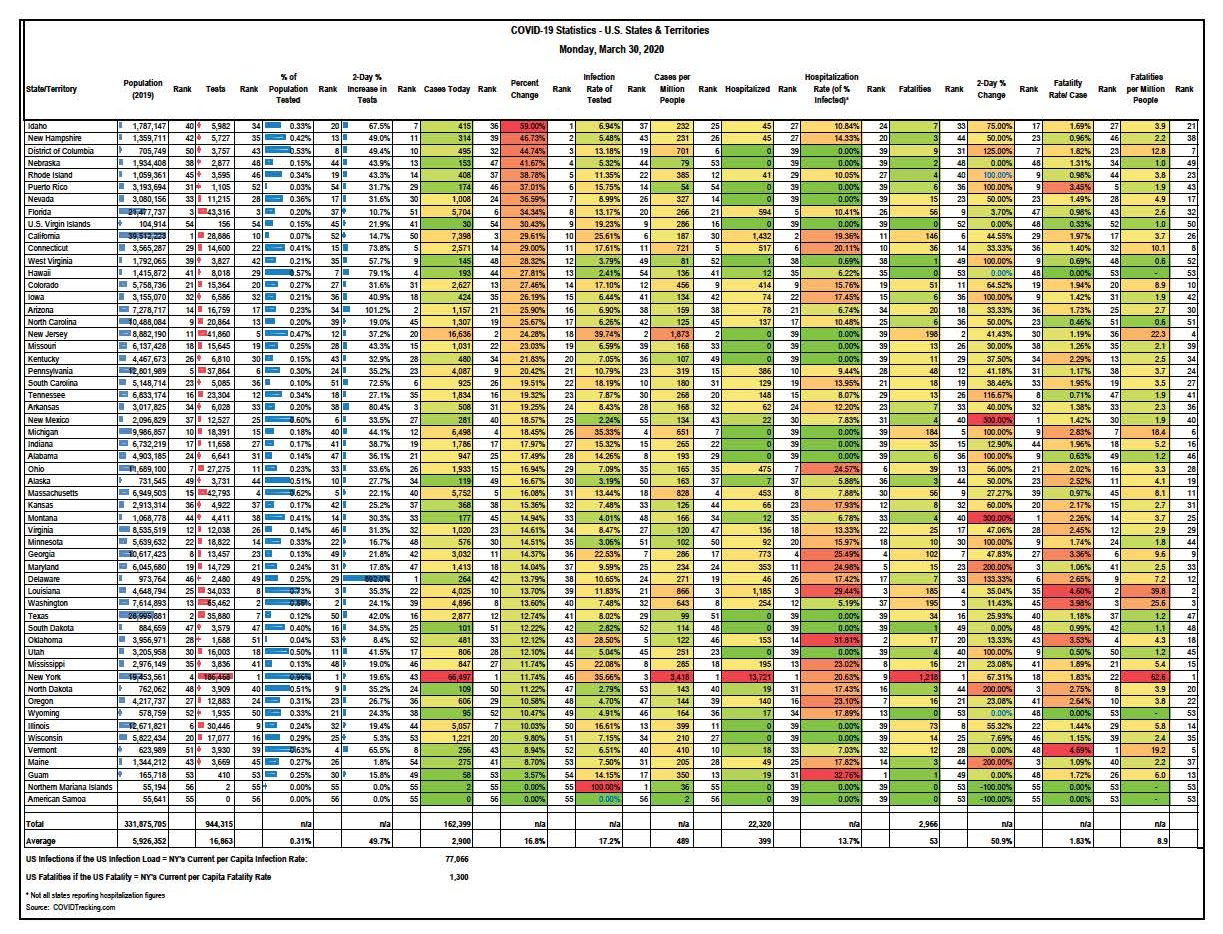
HSP compiled the following COVID-19 Statistics for U.S. States and Territories (sorted by cases per million people). This data stands as of Monday, March 30, 2020.
Scroll down to download this excerpt from HSP’s database.
Metrics that Matter for Monday night. I’ve sorted today’s table by % increase in cases to show that just like the worldwide countries, the headlines of today are focused on the big numbers in the hotspots, but the headlines of tomorrow will be about the numbers in those next geographic areas to explode. Idaho, New Hampshire, Washington DC, Nebraska, Rhode Island, Puerto Rico and Nevada are really exploding in growth rates. And if California could ever get its tests done, it will likely soon be #1 on many lists. It’s tested a paltry 0.07% of its population compared with the nationwide average of 0.31% and the top states of nearly 1.0% tested. The US nearly hit 1 million completed tests and these figures are jumping 15-20% per day now, allowing testing to catch up with reality. But reports from those I know around the country still say testing is a 7-day wait for results. The new Abbott test will be welcome equipment once it gets distributed.
Based on the low numbers of tests completed in certain states, I expect California, Texas and Georgia to start leaping up the lists to join Michigan, Florida, Massachusetts, New Jersey and New York.
Cities are not shown here, but we know that major metro areas are driving these numbers.
On the good news front, early hit states like New York, Washington and Illinois have seen their daily infection increase percent decrease to the near-single digits. As more people are tested, more certainly enters the picture. However, we have a long way to go, so stay safe out there. Enjoy the change of pace if you can. When we have to go back to “normal” you’ll wish you had all that free time back!


