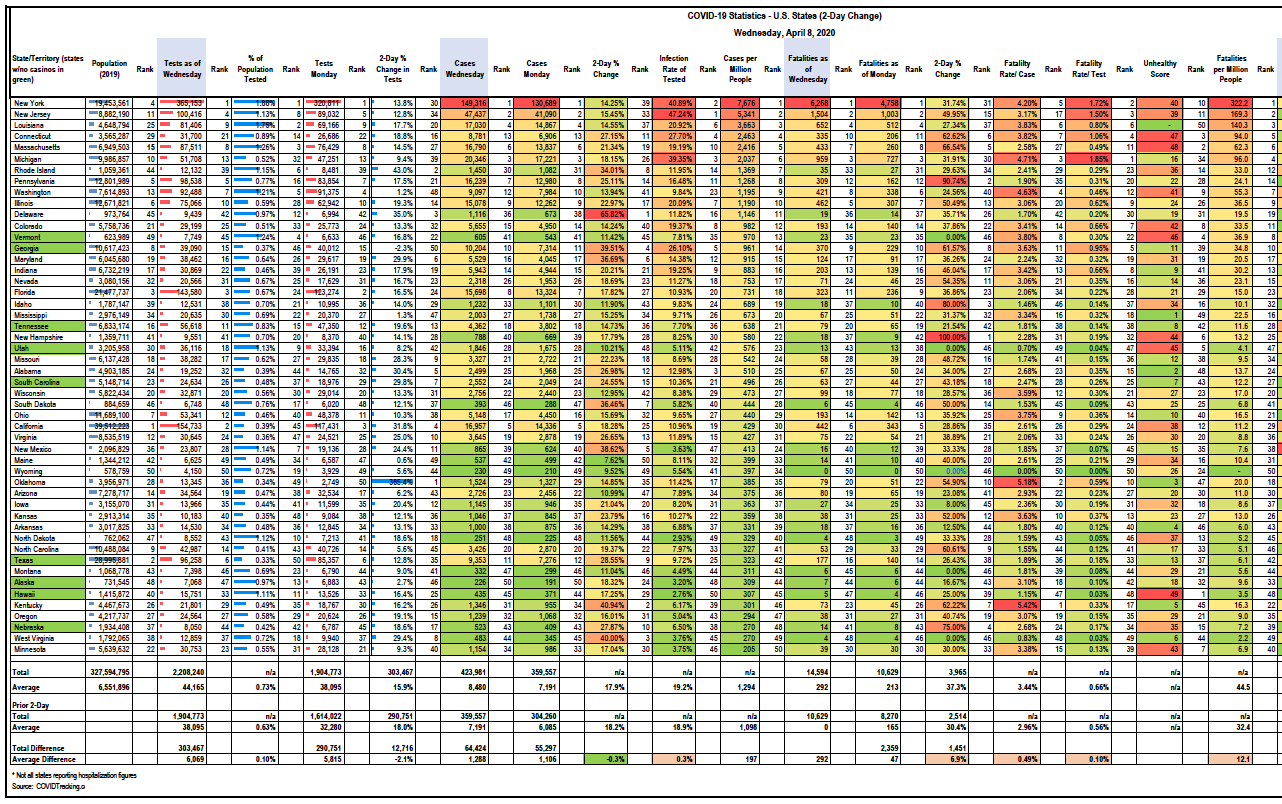
HSP compiled the following COVID-19 Statistics for U.S. States and Territories (sorted by cases per million people). This data stands as of Wednesday, April 8, 2020.
Scroll down to download this excerpt from HSP’s database.
State Infections. The top states have mostly stayed the same in terms of infections, except Washington, which has now fallen out of the top 10. This is a testament to their early actions to slow the spread (and the fact that they actually knew they had a case the earliest), while reportedly the virus was spreading without notice in NY/NJ.
The infection increase over the past two days has been highest in DE, KY, WV, GA, NM and MD. This suggests more bad news down the road. However, the worst hit states have slowed their increase, suggesting they are near their peak suffering.
Cases per million are still highest in NY, NJ, LA, CT, MA and MI. On the low end (hooray) are Minnesota, West Virginia, Nebraska, Oregon (good job!), HI and AK.
Infection rate of those tested still shows problems for our worst off states, as they are positive 40-50% of the time. But for states like Hawaii, North Dakota, AK, NM and MN, the cases per test are very low. This is good news!


