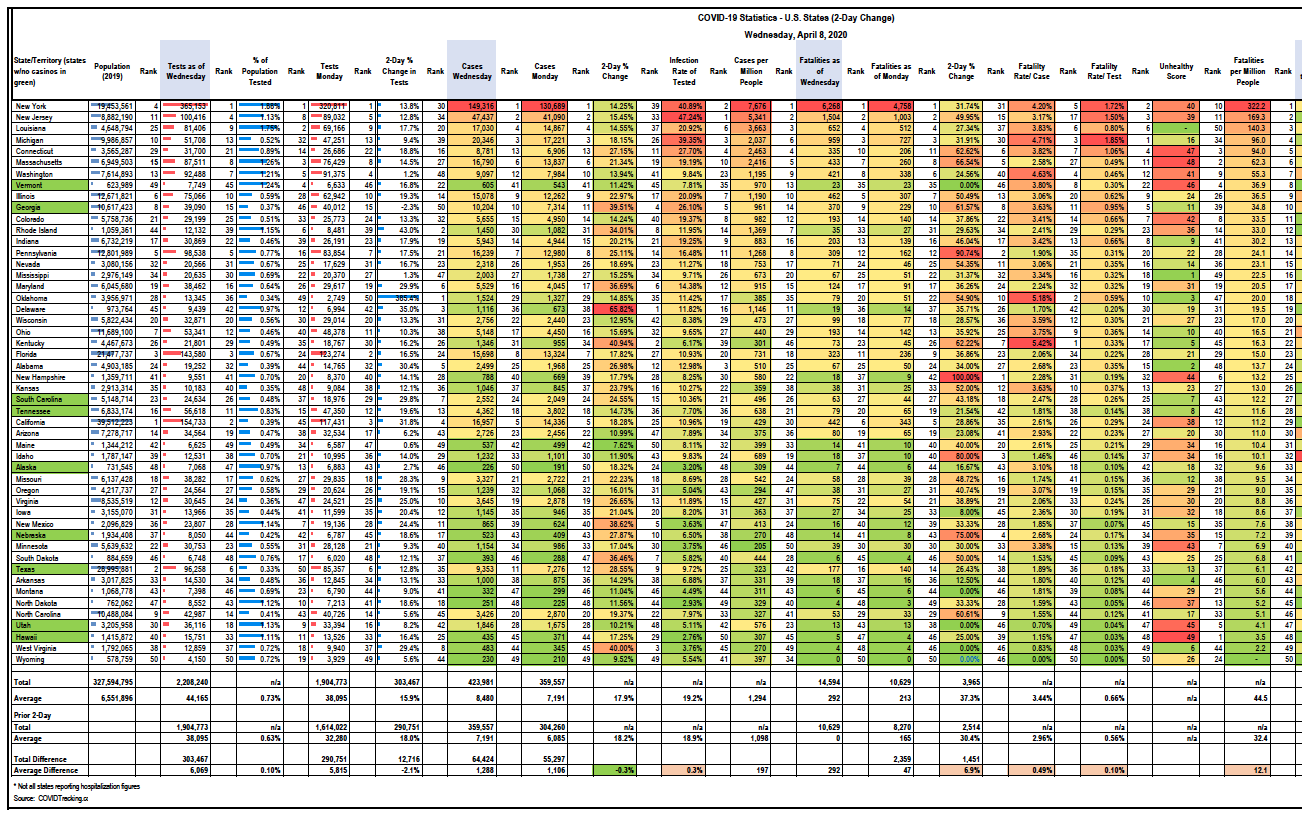
HSP compiled the following COVID-19 Statistics for U.S. States and Territories (sorted by cases per million people). This data stands as of Wednesday, April 8, 2020.
Scroll down to download this excerpt from HSP’s database.
State by State COVID-19 Fatality Metrics. It’s perhaps fitting for Passover and Easter week that it’s always darkest before the dawn. This has been and will continue to be a very tough week for thousands of families. The most impacted states are in their “peak week”, so new deaths are simply brutal.
NY/NJ make up more than 50% of the 14,500+ fatalities as of yesterday and each of the past two days have seen higher increases. But the new infections and hospitalizations are slowing in their growth, so we hope things improve.
The biggest increases in terms of % growth in fatalities are in New Hampshire, PA, ID, NE, MA, CT, KY and GA. These are the states that we are concerned mostly about as time goes on.
Fatality rates per case: Highest now in KY, OK, MI, WA, NY, LA and CT. This suggests the testing is not keeping up with the reality and is especially concerning for those states that have been worst off the longest. Are we really at or past the peak if half of those tested are positive? Sadly, I fear not. I’m most concerned about MI, NY, LA and MI.
But we have states that are lowering the average by giving us very low rates of death per infection: Wyoming (still the only state without a fatality), Utah, WV, HI and ID.
Fatalities per million will not surprise: NY, NJ, LA, MI, CT, MA and WA.
I’ll be adding in the “official” model from IHME next time around. They have reduced their official total death estimate through Aug 4 from 100k+ to 80K to now just 60k — all in the past week! This is good news and essentially what my data has been indicating all along. The near-term deaths I expect to be much lower, as I expect a quick peak, but then a slower reduction (i.e., not a bell curve, but spike then slow trail). I hope the reductions are dramatic after the peak, but it really depends on how long people can stay locked up.


